


S&P 500 and Nasdaq: Another all-time high for S&P 500
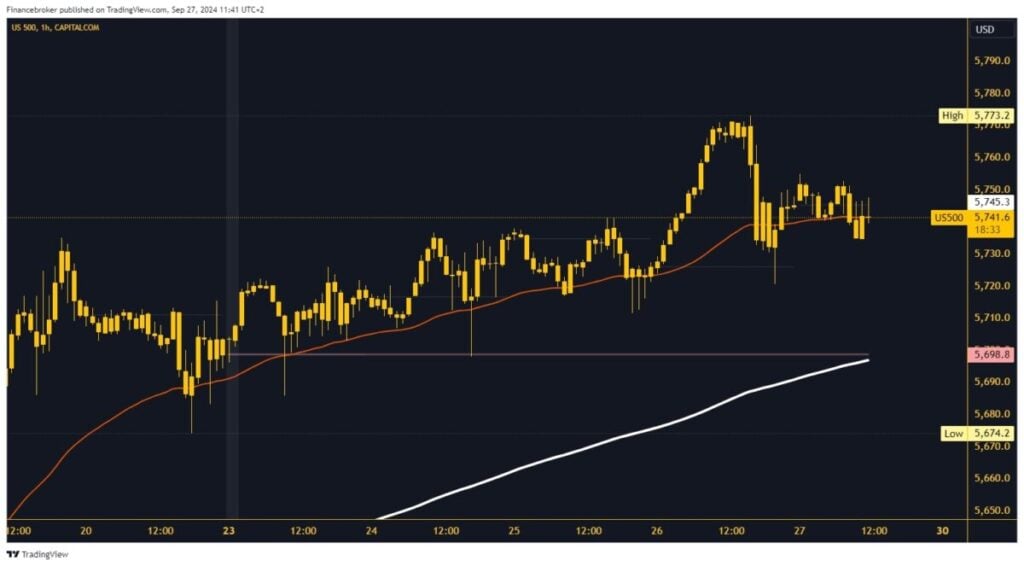
- Yesterday’s strong bullish consolidation pushed the S&P 500 index to a new all-time high of 5773.2
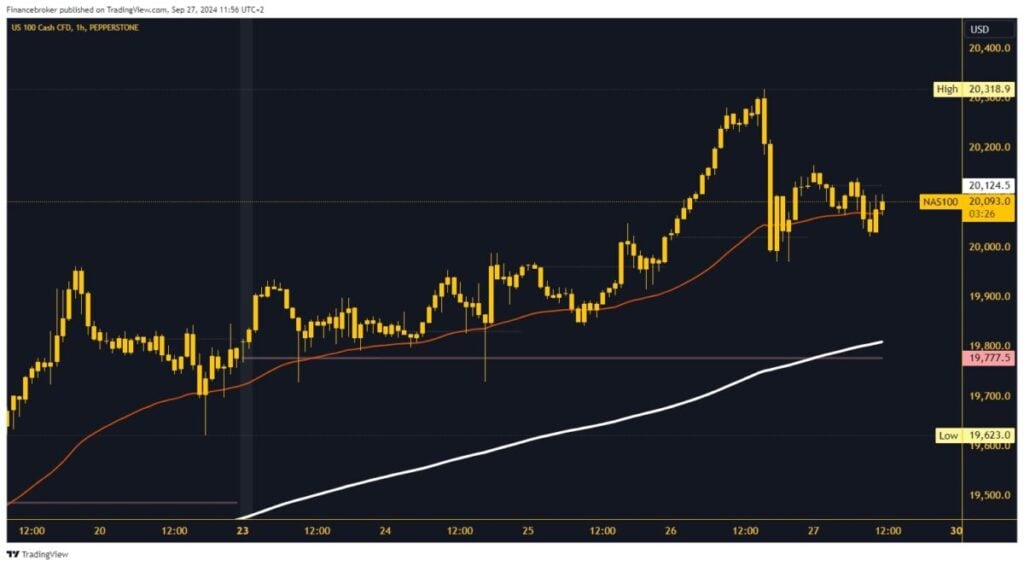
- On Wednesday, the Nasdaq returned above the 20000.0 level
S&P 500 chart analysis
Yesterday’s strong bullish consolidation pushed the S&P 500 index to a new all-time high of 5773.2. After a short consolidation in that zone, the index lost its momentum and started a retreat to the 5,720.0 level. Shortly after that, we found new support and moved back above the EMA 50 moving average. During this morning’s Asian trading session, the movement of the S&P 500 was calm in the 5740.0-5755.0 range.
In the EU session, we see a slight increase in bearish pressure and a drop in the index to the 5730.0 level. If this scenario continues, the S&P 500 will have to look for a new support level. Potential lower targets are 5720.0 and 5700.0 levels. For a bullish option, we need a positive consolidation and a jump to the 5760.0 level. After that, we can expect to start further growth and reach the previous high. Potential higher targets are 5770.0 and 5780.0 levels.
Nasdaq chart analysis
On Wednesday, the Nasdaq returned above the 20000.0 level. The index gained new momentum there and continued until 20318.9. At that level, we had strong resistance for further continuation, which had the effect of starting a bearish consolidation and a dog back to the 20000.0 level. During this morning’s Asian trading session, the movement took place in the 20070.0-20140.0 range. Nasdaq is trying to maintain this range despite the bearish pressure.
A return of the index above the daily open level would be an excellent indicator that we have enough strength to start a bullish consolidation. Potential higher targets are 20200.0 and 20300.0 levels. We need a negative Nasdaq consolidation below the 20000.0 level for a bearish option. With that step, we put pressure on yesterday’s low. This time, we need a break below and the formation of a new low to confirm the bearish momentum. Potential lower targets are 19900.0 and 19800.0 levels.
The post S&P 500 and Nasdaq: Another all-time high for S&P 500 appeared first on FinanceBrokerage.